CompareNodes provides independent and transparent RPC benchmarking services for blockchain nodes and endpoints.
Since May 2024 we have served private benchmarks for partners in the Decentralized Infrastructure Network (DIN). Thus far we have worked with Chainstack, Validation Cloud, Bware Labs, NorthWest Nodes, Liquify, InfStones, 0xFury, Artifact Systems, Grove, Nebula Block, etc.
Starting in January 2025, our benchmarking-as-service is in general availability to everyone. Our default regions are North America, Europe and Asia. Other regions are also available upon request.
For RPC Consumers & Sellers
RPC benchmarking-as-a-service is intended for RPC consumers like Dune Analytics as well as RPC “producers” such as Alchemy, QuickNode, GetBlock etc.
RPC consumers can utilize our services to obtain normalized benchmarking results about multiple RPC sellers during vendor selection activities. For example, we can run multiple rounds on Ethereum mainnet up to 20,000 RPC/s or more, with Alchemy and QuickNode. The data team at Dune could then use our results to choose the best provider for Dune’s use case.
Similarly, firms which sell RPC services can use our independent benchmarking results in their marketing and sales to demonstrate performance levels to potential customers.
To learn more about our value proposition, please schedule a consultation with our CTO Simon using this Calendly link.
Technology Stack
Our benchmarking stack is built on k6, Prometheus and Grafana. In the case of the EVM protocols, we use a suite of 24 scenarios which correspond to the most popular 24 RPC methods. A typical benchmark run will dispatch ~ 1 to 5 million RPC requests. Responses are classified into successes, failures and timeouts and we measure their counts and latencies. Results are then charted in Grafana dashboards. Error logs are available for further analysis, if necessary.
Completed results are delivered for private viewing in Grafana dashboard(s). The buyer of the benchmark can also decide if they wish the results to be published on CompareNodes.com and/or on their site using <iFrame>.
In the screenshots below, you can see an example of results as they would appear in a private Grafana dashboard.
Example Results
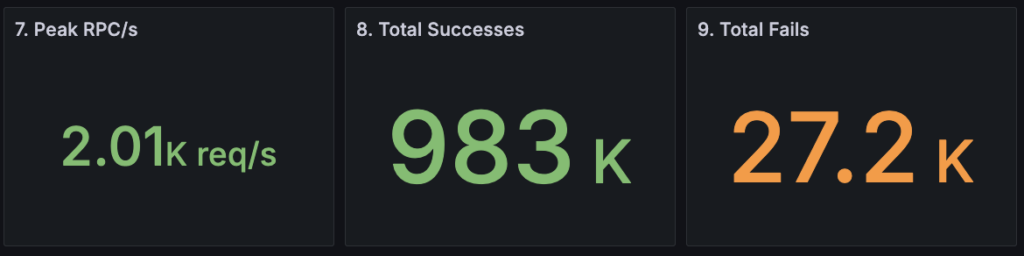
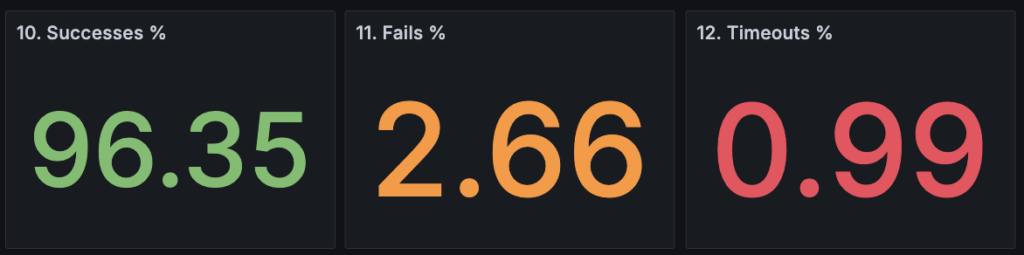
For this benchmark, we set a target of 2000 RPC requests per second against an endpoint serving Polygon Mainnet. Our goal was to demonstrate successes, fails and timeouts which is why our target is higher than the node’s capacity. As a result, we see 2.66% fails and 0.99% timeouts.
23 Panels of Statistics and Charts
Each benchmark run produces data for 23 panels of statistics and charts which are made available in Grafana for private viewing.
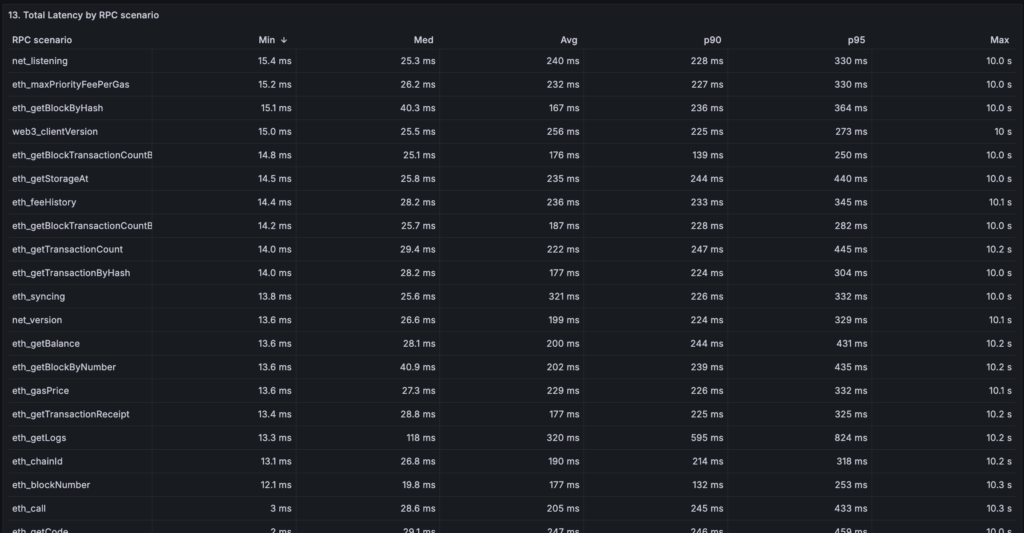
Panel No.13 shows a table of overall latencies by RPC scenario which correspond to each of the 24 methods for EVM protocols.
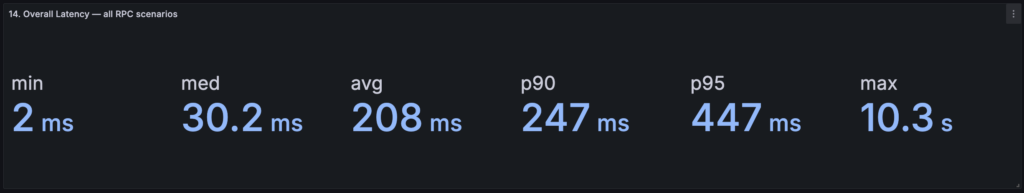
Overall latencies across all RPC scenarios are summarized in the panel No.14. Note that scenarios have configurable distributions. For this run, eth_call scenario was ~ 40% of all requests which means that the overall latencies will “lean” towards the measures observed for eth_call.
Additional documentation is made available to potential customers. During the preparation phase, we discuss the goals for each run. Then we determine the appropriate settings and request distribution percentage for each RPC scenario.
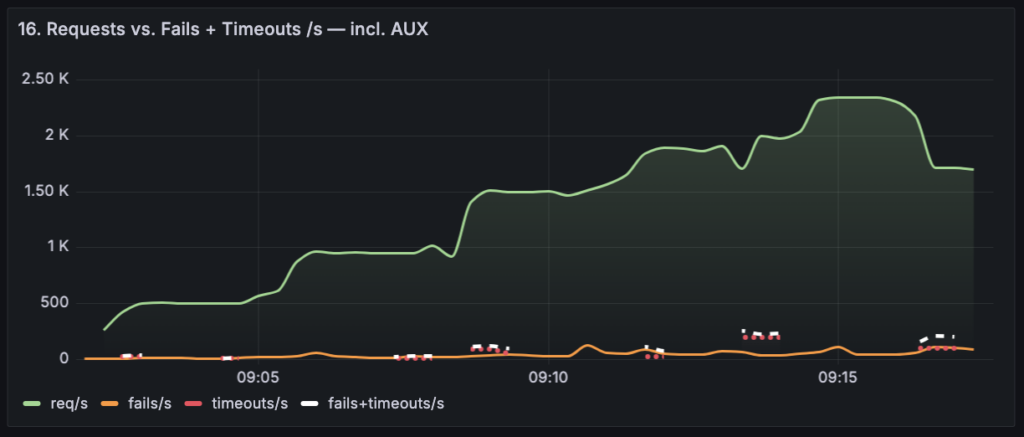
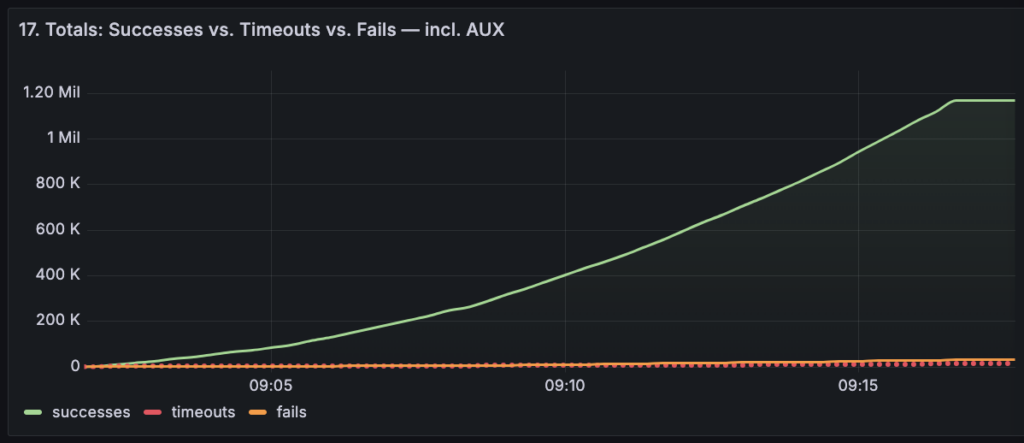
Panels No.16 and No.17 show the progression of total requests, successes, fails and timeouts during the 5 configurable stages. Each stage increases the requests rate from 20% to 100%.
Panels No.19 and No.20 are related. Observe the latencies for eth_call during the course of the benchmark and the spikes in fails (orange) or timeouts (red). In this case, the timeout duration was set to 10 seconds, which is why we can see spikes in the red lines in both panels.
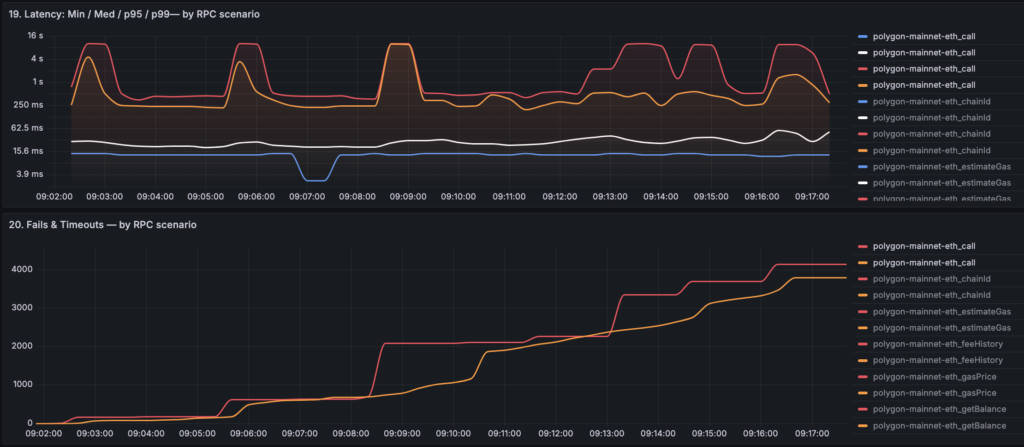
Depending on the RPC node and the middleware implementation at each provider, we could observe a variety of errors and unorthodox use of http codes. In some case, we get a response with the http code 200 (“OK”) and an error message in the json. Therefore, we don’t rely on http codes alone to classify responses into successes and fails.
RPC Scenarios vs. Aux Requests
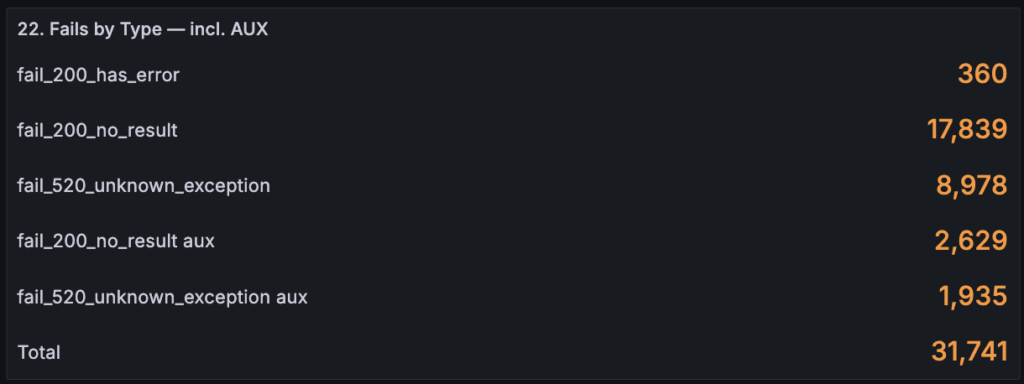
Panel No.22 shows the breakdown of fails by case. Note that the partial sum of entries without the “aux” suffix corresponds to the fails in panel No.9 at the top (27.2k fails).
“Aux” requests are generated by the k6 engine to obtain dynamic parameters (highest) block number and its hash. These values are used by 7 scenarios like eth_getBlockByHash and eth_getBalance. The outcome is that these scenarios “follow” the top of the chain during the course of the benchmark run. We isolate metrics for auxiliary requests so that the primary scenarios (eth_getBlockByHash) do not include the additional elapsed times.
Free Benchmarks & Discounts
We give at least 1 free private benchmark to each customer. It is our way to give back to the ecosystem.
Also, we offer flat plans for unlimited benchmarks and volume discounts for batches of 3, 10, 20 and 30 runs.
Please schedule a consultation with our CTO Simon using this Calendly link.