On February 4, 2024 we used our global RPC Performance Inspector app to compare latencies for 13 public endpoints on Fantom Mainnet from 27 locations on 6 continents. Our goal was to identify the best Fantom Mainnet public RPC endpoints.
Today we launched public infrastructure performance analytics for the Top 10 Fantom public RPC providers from our earlier analysis: 1RPC, Allnodes, Ankr, Blast API, BlockPI, DRPC, Fantom Foundation, Gateway.fm, Nodies and thirdweb.
Methodology
Both the Performance Inspector app and the newly launched Performance Public analytics page use our remote RPC probes in 27 AWS regions. The probes make a warmup RPC request which is omitted from the results. Its purpose is to exclude the time for DNS lookup and SSL negotiation.
Performance Inspector vs. Public Infrastructure Analytics
The key differences between the two performance tools can be summarized as:
- Anyone can run the inspector on-demand for 30 seconds. Continental and global results are arithmetic means (averages) of the underlying AWS regions.
- The public performance analytics are collected perpetually, in 1-minute intervals for a group of endpoints selected to represent the ecosystem. Its line charts are medians of the underlying results. The bar chart rankings are averages of the respective line chart over the corresponding time horizon (e.g. 30 minutes).
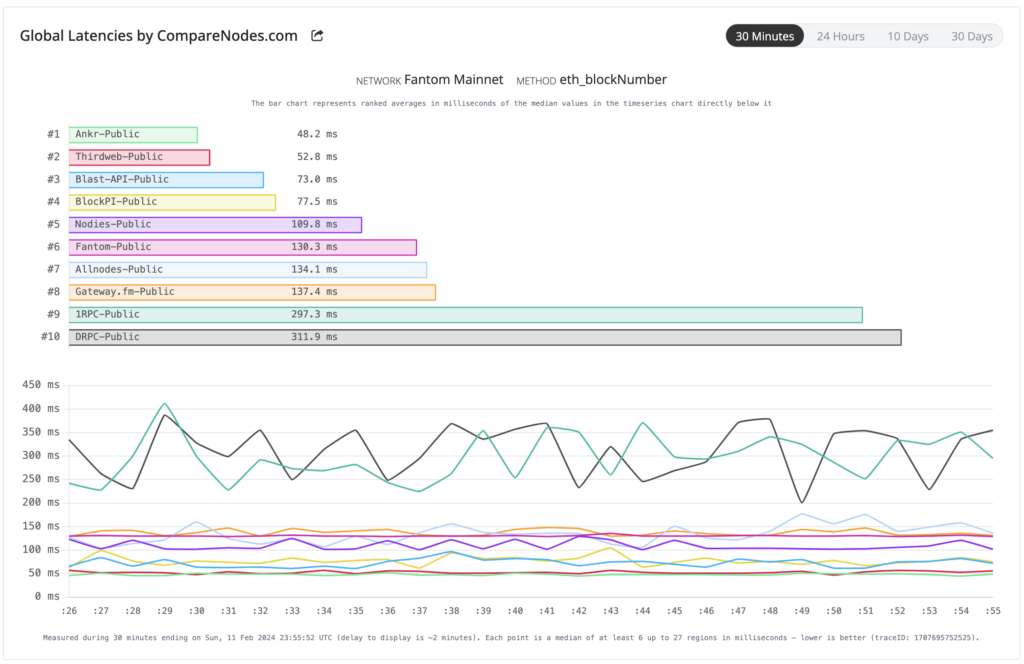
The global chart & ranking requires each endpoint to have at least one success in each continental group, in each time slice. Otherwise, the endpoint with excessive fails is omitted from the current global ranking.
In this screenshot, we can see that Ankr’s global median leads the pack with a result of ~48 milliseconds. Moreover, Ankr’s measures have very little variation as their line is “flat” while 1RPC and DRPC display significant oscillations.
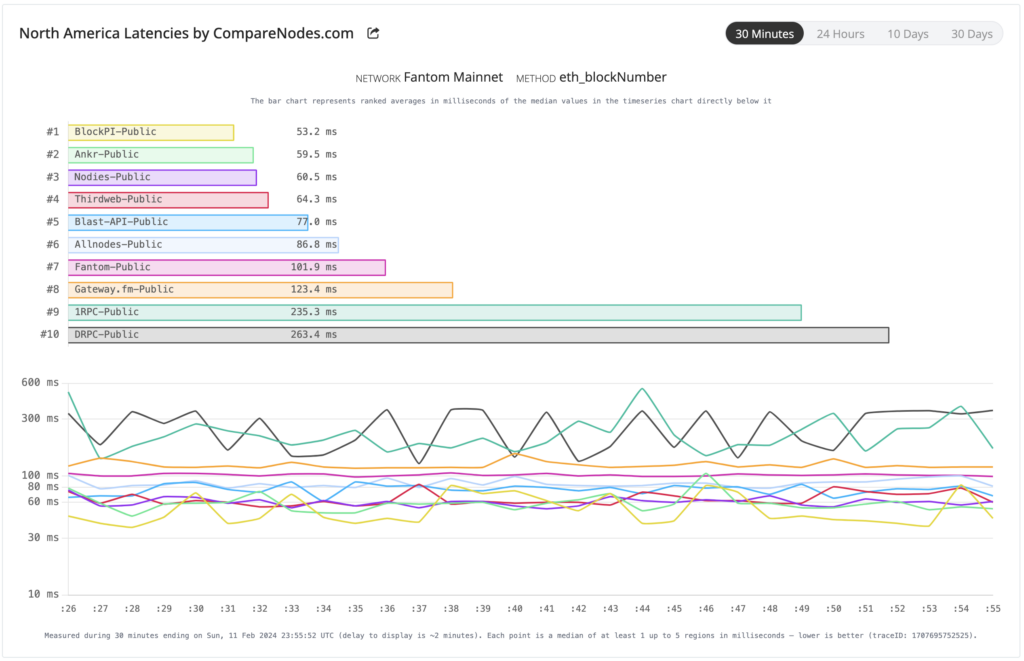
Continental charts sometimes have greater oscillations which is why their Y-axis is logarithmic. In this observation across North America, we can see that BlockPI has the lead.
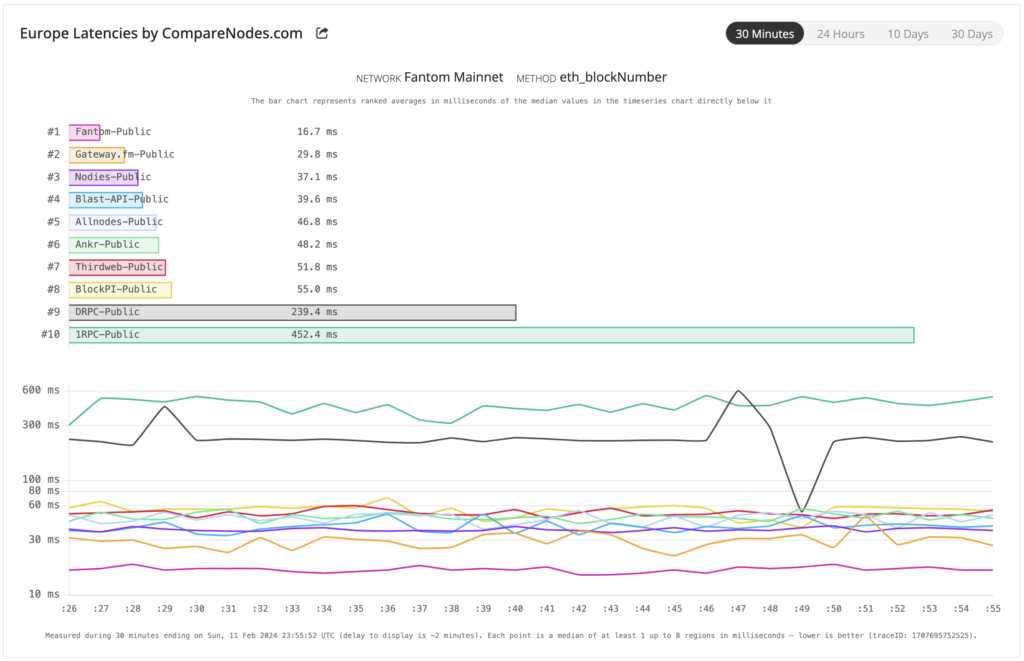
In Europe we measure from 8 locations and our observations imply that Fantom Foundation infrastructure team decided to focus there.
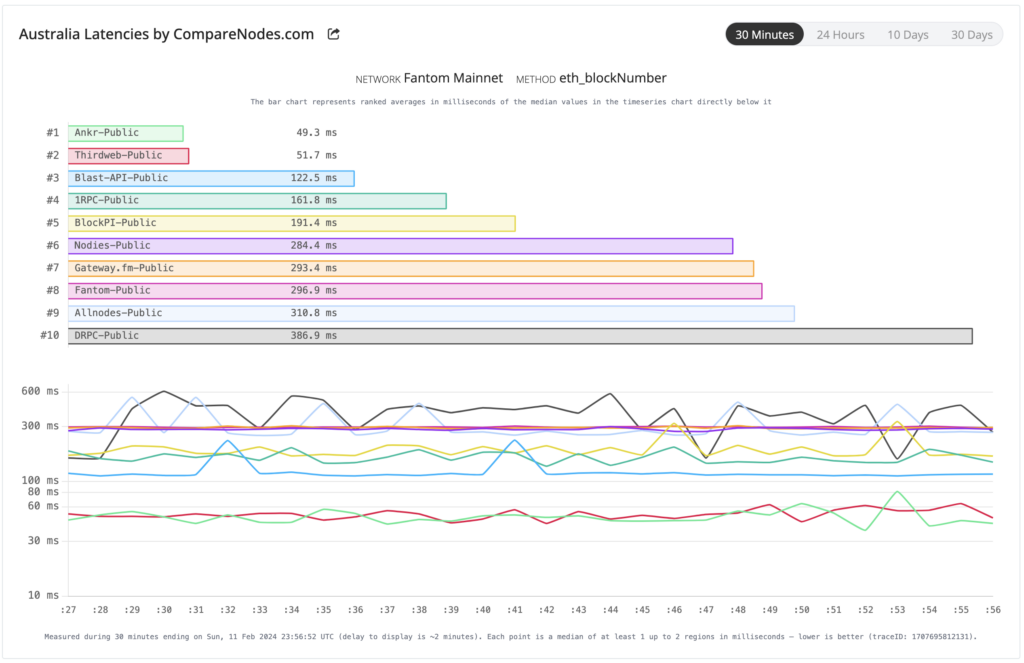
Our last example is about the the two locations representing Australia. Since we use Sydney and Melbourne locations, the lines below are both the medians and averages since a median of 2 values equals to their average.
Additional information about each computation is available in each FAQ.
Our roadmap is full of improvements. Soon we will show counts of RPC errors as well as longer horizons including 24hours, 10days and 30days.