RPC providers pick data centers in different locations to run their load balancers, clusters and nodes. Each RPC consumer might traverse a different networking path to reach the specific endpoint provider, which can result in lower or higher round-trip times.
It means that the “best” endpoint can depend on:
- “Your” location where the request originates
- How the provider routes requests
- How fresh the provider’s node data is
- How the endpoint handles repeated requests
- Whether WebSocket or gRPC streams stay connected and deliver updates quickly
- Whether rate limits or timeouts appear under normal usage
RPC Inspector Pro measures RPC endpoint performance with probes in 32 locations on 6 continents to independently quantify these differences. You don’t have to naively believe claims made by providers nor guess based on one machine or one cloud region.
RPC Inspector Pro is free and available at:
https://www.comparenodes.com/performance-inspector-pro/
Performance Scope
RPC Inspector Pro can measure one endpoint, or compare two endpoints, side-by-side.
For one endpoint, the results help answer questions like:
- Is this endpoint fast from the regions you care about?
- Does it return fresh and consistent data?
- Does it rate limit or time-out from some places?
- Do live stream updates arrive evenly across regions?
For two endpoints, the report compares Endpoint A and Endpoint B across the same locations.
Inspector is compatible with almost all providers so that your can easily compare Alchemy vs. Quicknode, Chainstack vs. GetBlock, Tatum vs. Ankr, Validation Cloud vs. NOWNodes etc. Or, compare a private / paid endpoint against a public fallback.
Two-endpoint comparisons require both endpoints to be on the same network e.g Base mainnet or Ethereum Sepolia etc.
Run RPC Inspector Pro
Measure performance in three short steps.
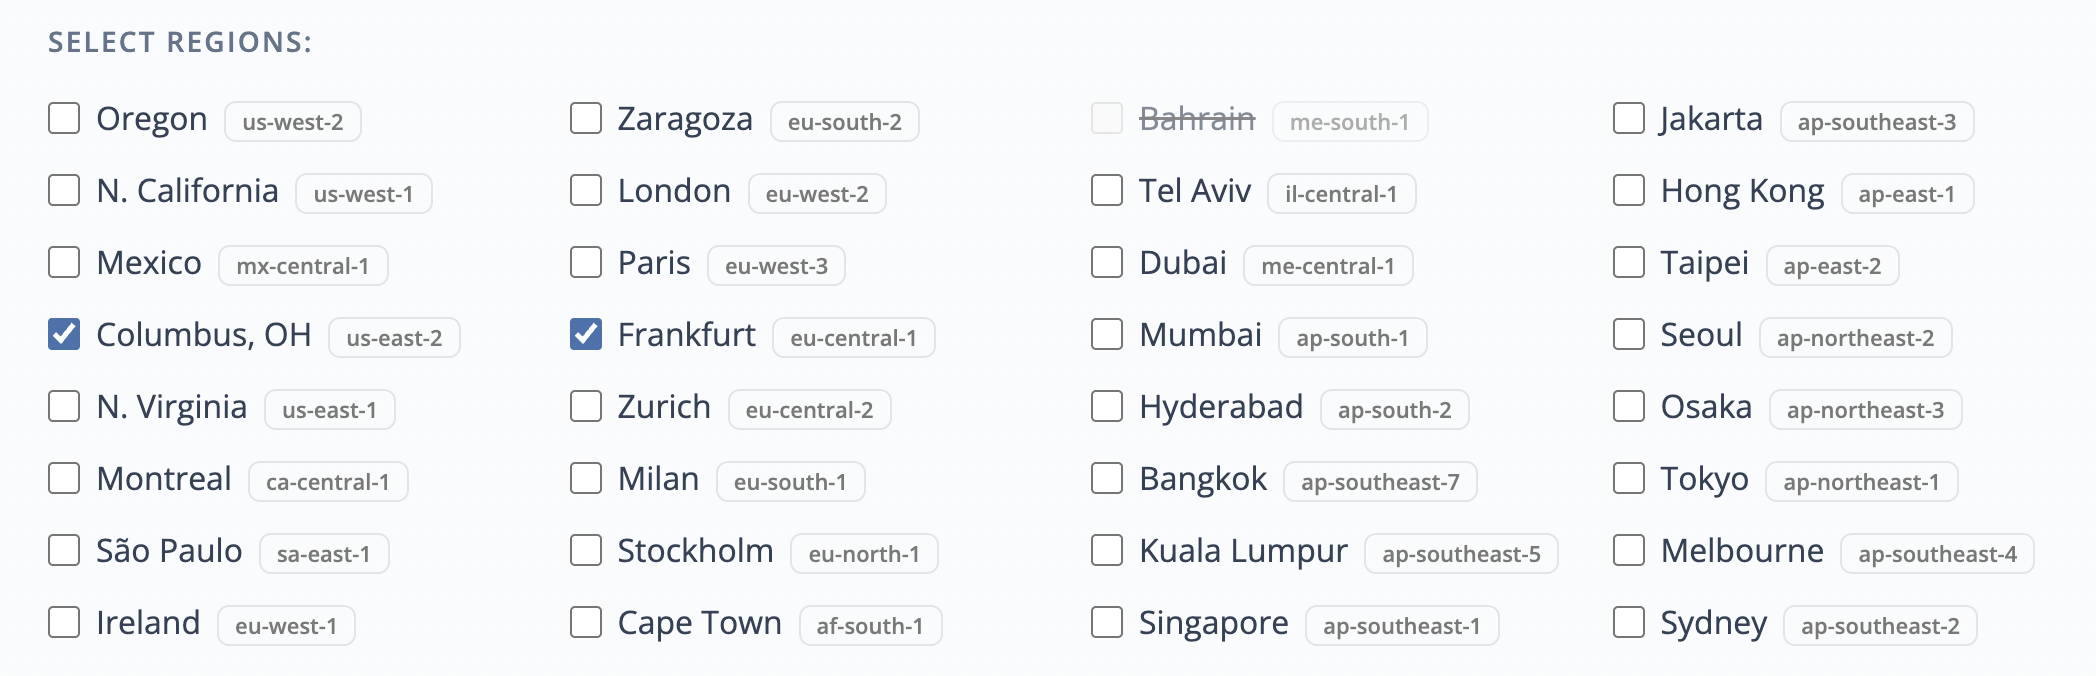
First: choose the probe locations (regions). These are the AWS data centers that will run the measurements. More regions give you a broader view of global behavior. A smaller region set is useful when you care about a specific market or want a faster, more focused check.
Second: enter one or two endpoints. Endpoint A is required. Endpoint B is optional and is used for comparisons:
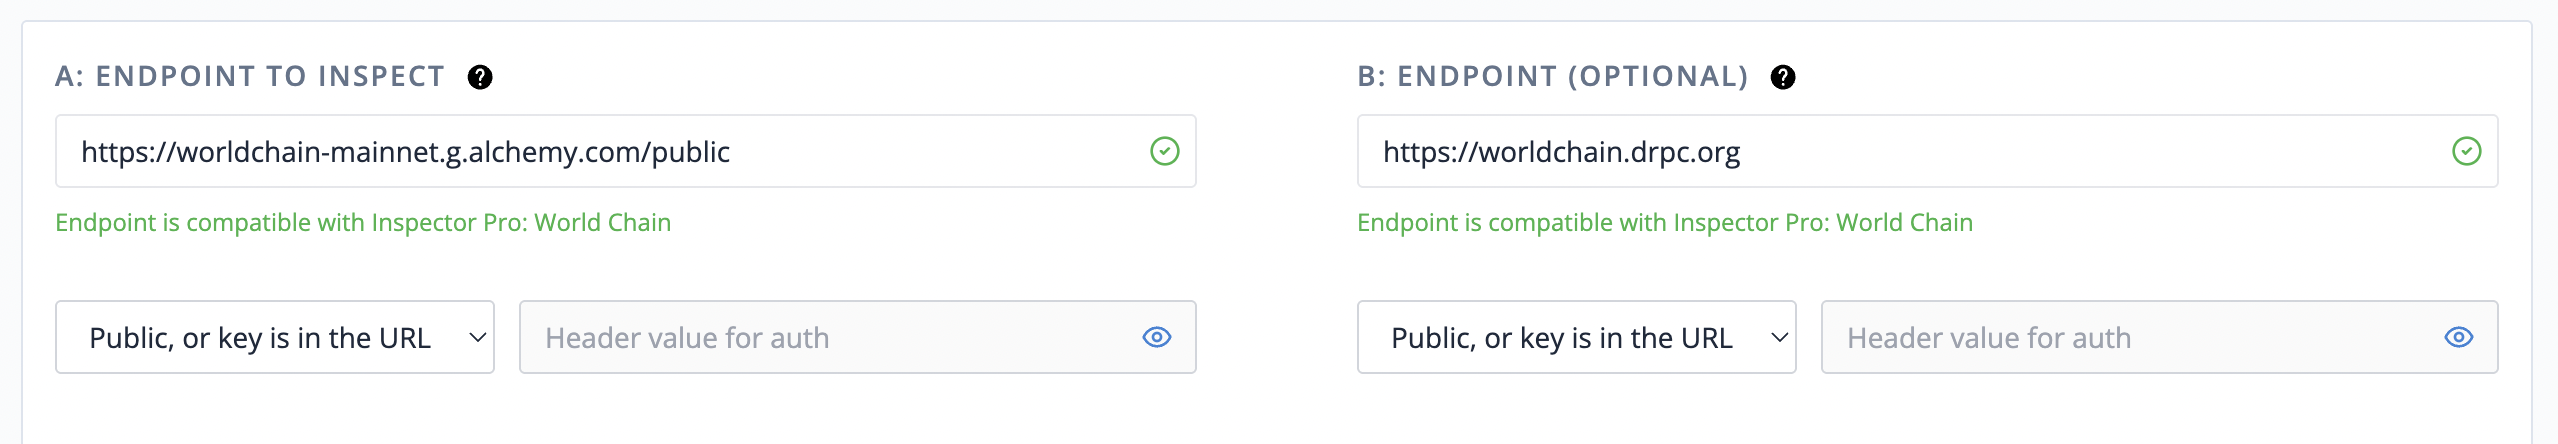
Private endpoints are supported. Many private RPC endpoints include an API key in the URL, and RPC Inspector Pro accepts that format. For reporting, it stores and displays only the endpoint host or domain, not the full URL. Auth header values are not stored.
If your endpoints are public like the example in the screenshot, then you should just ignore the inputs for Auth Header & Value.
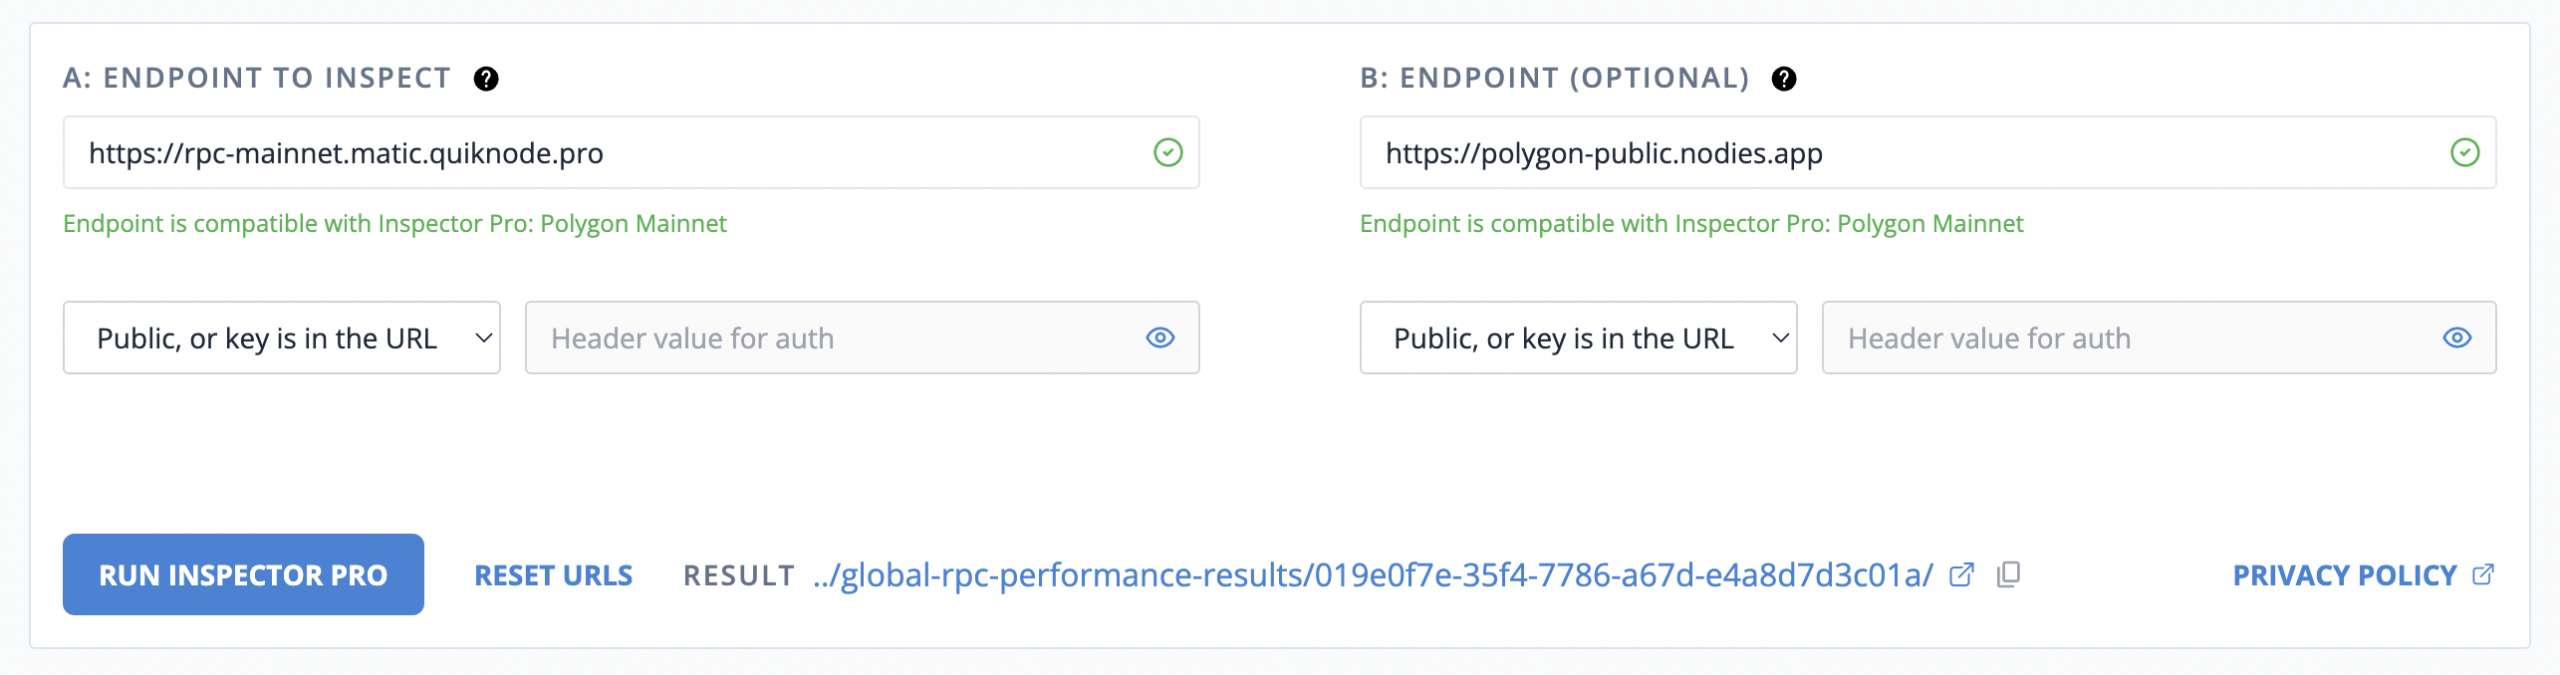
Third: run the inspector and keep the page open until completion in about 35 seconds. When the results are ready you will see their URL near the RUN button:
Performance Scenarios
RPC Inspector Pro can measure 6 categories of protocols and their networks:
- EVM networks like Ethereum, BSC, L2s etc,
- Substrate like Polkadot,
- Cosmos a.k.a. CometFBT a.k.a. Tendermint like Cosmos HUB,
- SVM like Solana,
- UTXO like Bitcoin and Litecoin,
- Sui.
In May 2026 there are 12 scenarios in 2 groups:
- Request-response: EVM, Substrate, Cosmos, SVM and UTXO,
- Subscription: EVM, Substrate, Cosmos, 3 x SVM and Sui.
Request-response means that the probe sends a request and awaits a response to that dispatch before performing other actions, or the probe records a timeout after 4,000 milliseconds (fail). These scenarios work with endpoints whose URL starts with https:// or http:// .
Subscription scenarios send one or two messages (warmup + subscription) and then expect one or more responses in a continuous “stream” without further dispatches by the probe. These scenarios are triggered with URLs for WebSocket like wss:// or ws:// or gRPC, e.g. grpcs://, grpc://.
Endpoint Compatibility and Network Detection
When you submit an endpoint, RPC Inspector Pro will automatically detect its network and compatibility with available scenarios.
URLs with https:// or http:// will be evaluated for request-response scenarios. These are standard JSON-RPC or REST-style requests.
Similarly, wss:// or ws:// URLs are evaluated for WebSocket subscription scenarios. They measure live stream behavior, such as new block headers or Solana slot and block subscriptions.
Lastly, grpcs://, grpc://, and URLs like example.com:443 are designated for gRPC subscription scenarios. Do not submit gRPC endpoints as https://..., even if the endpoint uses port 443.
Request-Response Scenarios
These are all implemented as pairs of two chained requests. It means that data from the 1st response in the pair is then used to create the request payload for the 2nd request. Also, each probe does a warmup request before collecting any telemetry. The warmup is not included in the result, unless the warmup is the reason for termination (e.g. too-many-requests, timeout etc.). The warmup is useful to separate the lapsed times needed for DNS and TLS.
In case of the EVM networks, the probes use eth_getBlockNumber(latest, false) to obtain the block number, its timestamp and the block hash. Then the probe uses the block hash to dispatch eth_getLogs(hash).
The chaining of requests confirms that the endpoint really does serve details about blocks it announced in the 1st response. Otherwise, we label no-such-block responses as “not-available” and reduce the availability percentage for this endpoint / location (region). When the 2nd response does return a valid payload, the probe computes its “fingerprint” to confirm it is identical with earlier / later responses for the same “ID” (e.g. must have same count of transactions for the same block hash). If the fingerprints don’t match, the probe will mark all corresponding responses as “not-available” instead.
In summary, all request-response scenarios run pairs of chained requests and collect the following telemetry about each endpoint in each selected location:
- Latency: how long successful requests take,
- Consistency: whether block, slot, or height numbers move forward only on subsequent responses,
- Availability: whether the endpoint can serve the data it just reported,
- Age: how old the returned block or slot appears to be at the time of arrival and based on its timestamp (if available),
- Propagation / lag: is optional for runs with 2 endpoints and detects occurrences when either endpoint is verifiability lagging the other on block number / slot etc.
Since runs are short but can dispatch 100+ requests per second, each probe terminates its processing immediately if it receives “429” (too many requests) response.
Subscription Scenarios
All scenarios about subscriptions measure arrival times in probes for the messages sent from the nodes.
Ideally, all blocks-slots-checkpoints (notifications) would arrive everywhere at the same moment. But nodes themselves receive chain data at different times and are able to dispatch them to you depending on the capacity of the node / cluster serving you (in your specific location) and the networking distance to you.
The simplest scenario example is one endpoint and two locations: e.g. Oregon and Frankfurt. In such a case, the two probes would open connections to the endpoint and wait for the arrivals from the nodes to tag them with timestamps in their location.
At the end of the run, both probes submit their data to generate the results. The two sets of timestamps are merged and compared by the unique IDs of the messages like block hash or slot number or checkpoint number (Sui).
For each unique ID (e.g. block hash), one arrival was 1st and the other happened some milliseconds later which is used to calculate the “lag” of the other arrival.
Therefore, we can determine which of the two probes was better at seeing the blocks sooner (earlier arrivals) and the lag statistics for both across each seen block and overall for the run.
If you run just one endpoint and multiple locations (regions), then use the results to understand the best location to consume the data served by that endpoint provider.
Subscription with 2 Endpoints
Running with two endpoints adds another comparison: block-region leadership (or slot-region leadership). Each arrival in each region, is used as + / – counter for each endpoint. E.g. 2 endpoints with 10 regions and 30 unique block hashes is like 300 “races” between the two endpoints. In each location we had 30 chances for the probe “A” or probe “B” to be the 1st to observe it. If the probe A was the winner 254 times whereas the probe B won 40 times, we can say that endpoint A is better at deliver notifications sooner, for this group of locations (regions).
In general, the subscription scenarios can help answer:
- Are there gaps in the stream?
- Which regions receive updates first?
- Does one endpoint consistently deliver updates ahead of another?
- Does the stream connect successfully and stay useful long enough?
Subscription via WebSocket
Transmission technology depends on each protocol.
Generally, EVM protocols do expose wss:// or ws://. RPC Inspector Pro will detect such an endpoint and automatically select the “newHeads” scenario. Same applies to SVM, Substrate and Cosmos networks.
For Solana networks, RPC Inspector Pro uses blockSubscribe when supported by one or both endpoints. Otherwise, the probes will attempt to use slotSubscribe instead.
Subscription via gRPC
Some networks and providers expose live data through gRPC. RPC Inspector Pro supports gRPC subscriptions for Sui checkpoints and Solana’s Yellowstone/Geyser endpoints with block subscription.
Mixed gRPC and WebSocket for Solana
Is Yellowstone/Geyser gRPC stream so much better than a WebSocket to justify the additional expense?
The mixed gRPC and WebSocket Solana scenario compares the two transports in one run:
- Endpoint A is a Yellowstone/Geyser gRPC endpoint (e.g. Alchemy)
- Endpoint B is a Solana WebSocket endpoint (e.g. Quicknode)
- Both endpoints must be on the same SVM network (e.g. mainnet)
- Both are subscriptions to blocks: see results for Alchemy gRPC vs. Quicknode WebSocket
Review Results Page
Results page is built from datasets. One dataset is one endpoint measured from one selected region (location). A one-endpoint run with ten selected regions expects ten datasets. Similarly, a two-endpoint run with ten selected regions expects twenty datasets.
The four main sections are common to request-response and subscription scenarios but their content is different and adjusted for 1-endpoint or 2-endpoints.
Findings section summarize the most important takeaways and point to notable differences, missing data, or endpoint behavior expressed in success, fails and 429s (too-many-requests).
When running with 2 endpoints, the findings will show green / red if the data shows a clear winner like this example, because Quicknode had 517 leading block-region observations while Alchemy had just 314:

In another case, the results do not mark the green / red because the two providers each “won” the global p95 latency for one of the two methods so it is a “split” decision:
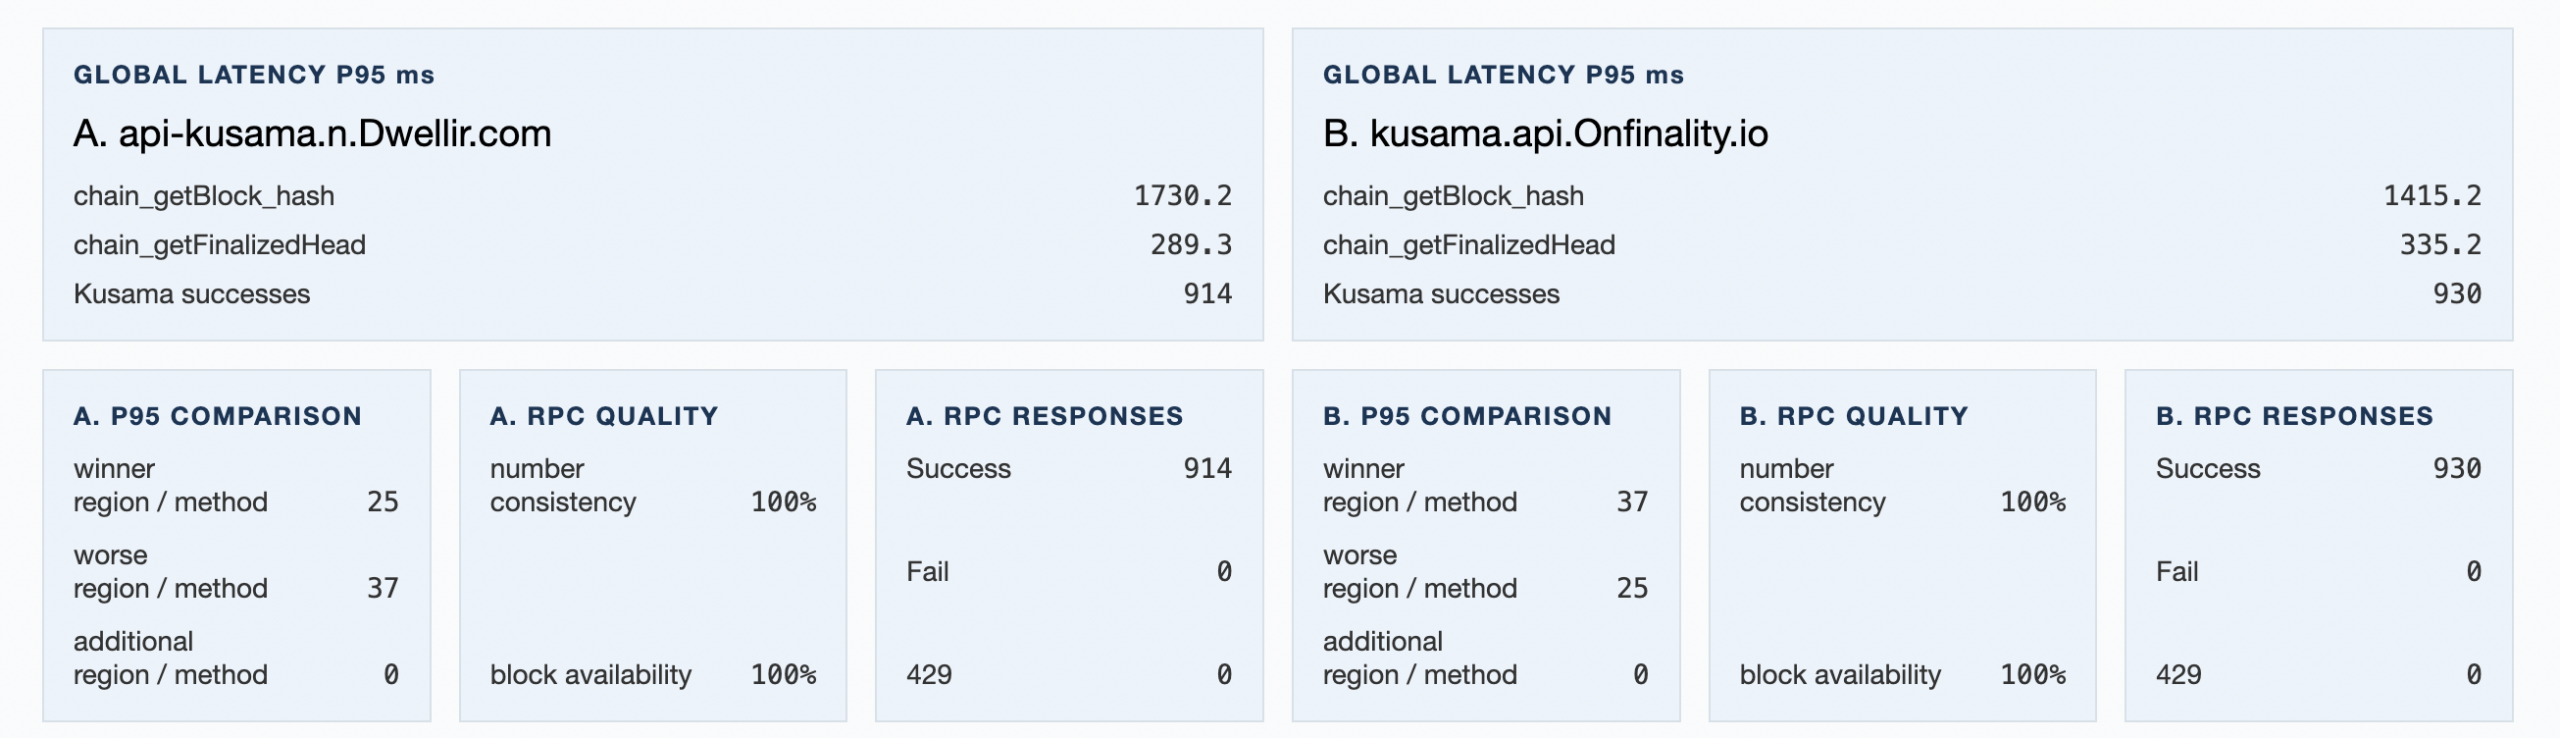
Summary tables give a broad metric view across regions and endpoints. Use them to review overall latency, response quality, availability, propagation, or leadership patterns.
For request-response runs the summary table will be computed if the details include at least two locations in the same continent group. Moreover, the global rollup will be aggregated only if the details contain data about each of the 6 possible continents.
Details tables show the underlying region-level or endpoint-region-level rows. Technical users can use these tables to inspect exactly where a provider performed well or poorly.
Errors show retained evidence for failures, setup problems, rate limits, timeouts, and other issues that may explain why a dataset or measurement is incomplete.
The report may show that some selected datasets were missing or arrived too late for a report pass. Read that carefully. A missing dataset is not always proof that the endpoint failed; it can also reflect timing, infrastructure, or report-generation boundaries. The report separates dataset availability from later inclusion in specific tables or calculations.
Propagation Results via Subscription
For subscription scenarios, propagation is not a single number. The report provides several views because each one answers a different question.
The fairest headline is block-region, slot-region, or checkpoint-region leadership in Findings. This compares Endpoint A and Endpoint B for the same block, slot, or checkpoint in the same probe region. That matters because it avoids mixing geography into the endpoint comparison. If Endpoint A wins a block-region comparison, it means Endpoint A delivered that same unit earlier than Endpoint B in that same region.
For one-endpoint reports, the related concept is block, slot, or checkpoint leadership. It shows which probe regions saw each unit first for that endpoint. This helps you understand regional delivery patterns, but it is not an endpoint-vs-endpoint contest.
Summary by dataset answers a different question: “How did each endpoint-region dataset behave overall?” It is useful for spotting regions or endpoints with consistently slower arrivals, zero observations, stream gaps, setup failures, or poor response quality. This view is endpoint-region centered, so it is good for diagnosing where behavior differs.
Summary by block, slot, or checkpoint is unit centered. It shows what happened for each observed unit across the available datasets. This is useful when you want to inspect a particular block, slot, or checkpoint and see where it arrived first, where it arrived later, and where evidence was missing.
In practice:
- Use Findings leadership to understand the fairest endpoint comparison.
- Use Summary by Dataset to diagnose endpoint-region behavior.
- Use Summary by Block, Slot, or Checkpoint to inspect propagation of individual units.
Practical Ways to Use the Results
If you operate an application with users concentrated in a few regions, focus first on those probe regions. A global average may be less useful than knowing which endpoint behaves best near your actual users.
If you are choosing between two providers, run them together as Endpoint A and Endpoint B on the same network. That gives the report a fairer comparison surface because both endpoints are measured from the same selected regions during the same run.
If you rely on live updates, use the WebSocket or gRPC subscription tests instead of relying only on request/response latency. A provider can answer ordinary requests quickly while still delivering live stream updates later than another provider.
If you see rate limits, timeouts, or setup failures, inspect the Errors section before drawing conclusions from summary numbers alone. Failures are part of endpoint behavior, and they often explain why a provider looks strong in one region and weak in another.
If you use private endpoints with API keys, you can submit the provider URL as you normally use it. The report is designed to show host or domain labels rather than full secret-bearing URLs.
Disclaimers
RPC Inspector Pro delivers evidence at a specific point in time, with specific endpoints and for the selected regions. Resit the “desire” to make any of these assumptions:
- Which provider is permanently best
- Which endpoint will be best for every application
- How much is the maximum capacity for some endpoint
- How an endpoint behaves under sustained stress benchmarking
- That a missing dataset is automatically an endpoint outage
- That stream arrival timestamps are first-byte network timings
- that endpoints on different networks can be compared meaningfully
The strongest use of RPC Inspector Pro is repeated, practical measurement: compare the endpoints you are actually considering, from the regions you actually care about, using the endpoint type your application actually uses.
RPC Reference
Request-response Scenarios & Request Methods
- EVM:
eth_getBlockByNumber, theneth_getLogs(hash) - SVM:
getSlot(finalized), thengetBlock(slot) - Polkadot/Substrate:
chain_getFinalizedHead, thenchain_getBlock(hash) - Cosmos/Tendermint:
/status, then/block?height= - UTXO:
getblockchaininfo, thengetblock(hash, 1)
Subscription Scenarios & Subscription Methods
- EVM:
newHeadsover WebSocket - SVM:
blockSubscribe(finalized)orslotSubscribeover WebSocket - SVM: block or slot subscriptions over Yellowstone/Geyser gRPC
- Mixed SVM: Yellowstone/Geyser gRPC as Endpoint A with WebSocket as Endpoint B for block subscriptions
- Polkadot/Substrate:
subscribeFinalizedHeadsover WebSocket - Cosmos/Tendermint:
NewBlockHeaderover WebSocket - Sui:
SubscribeCheckpointsover gRPC